Lord Ashcroft KCMG PC is an international businessman, philanthropist, author, and pollster. For more information on his work, visit lordashcroft.com.
The betting scandal was the most noticed election story in recent days, according to my latest campaign poll – which also finds that most Labour voters oppose building on the green belt, that 2019 Tories are divided as to whether the Conservatives or Reform would be the most effective opposition to a new Labour government, and that most former Tories are not swayed by arguments about a Labour ‘supermajority’.
What have people noticed?
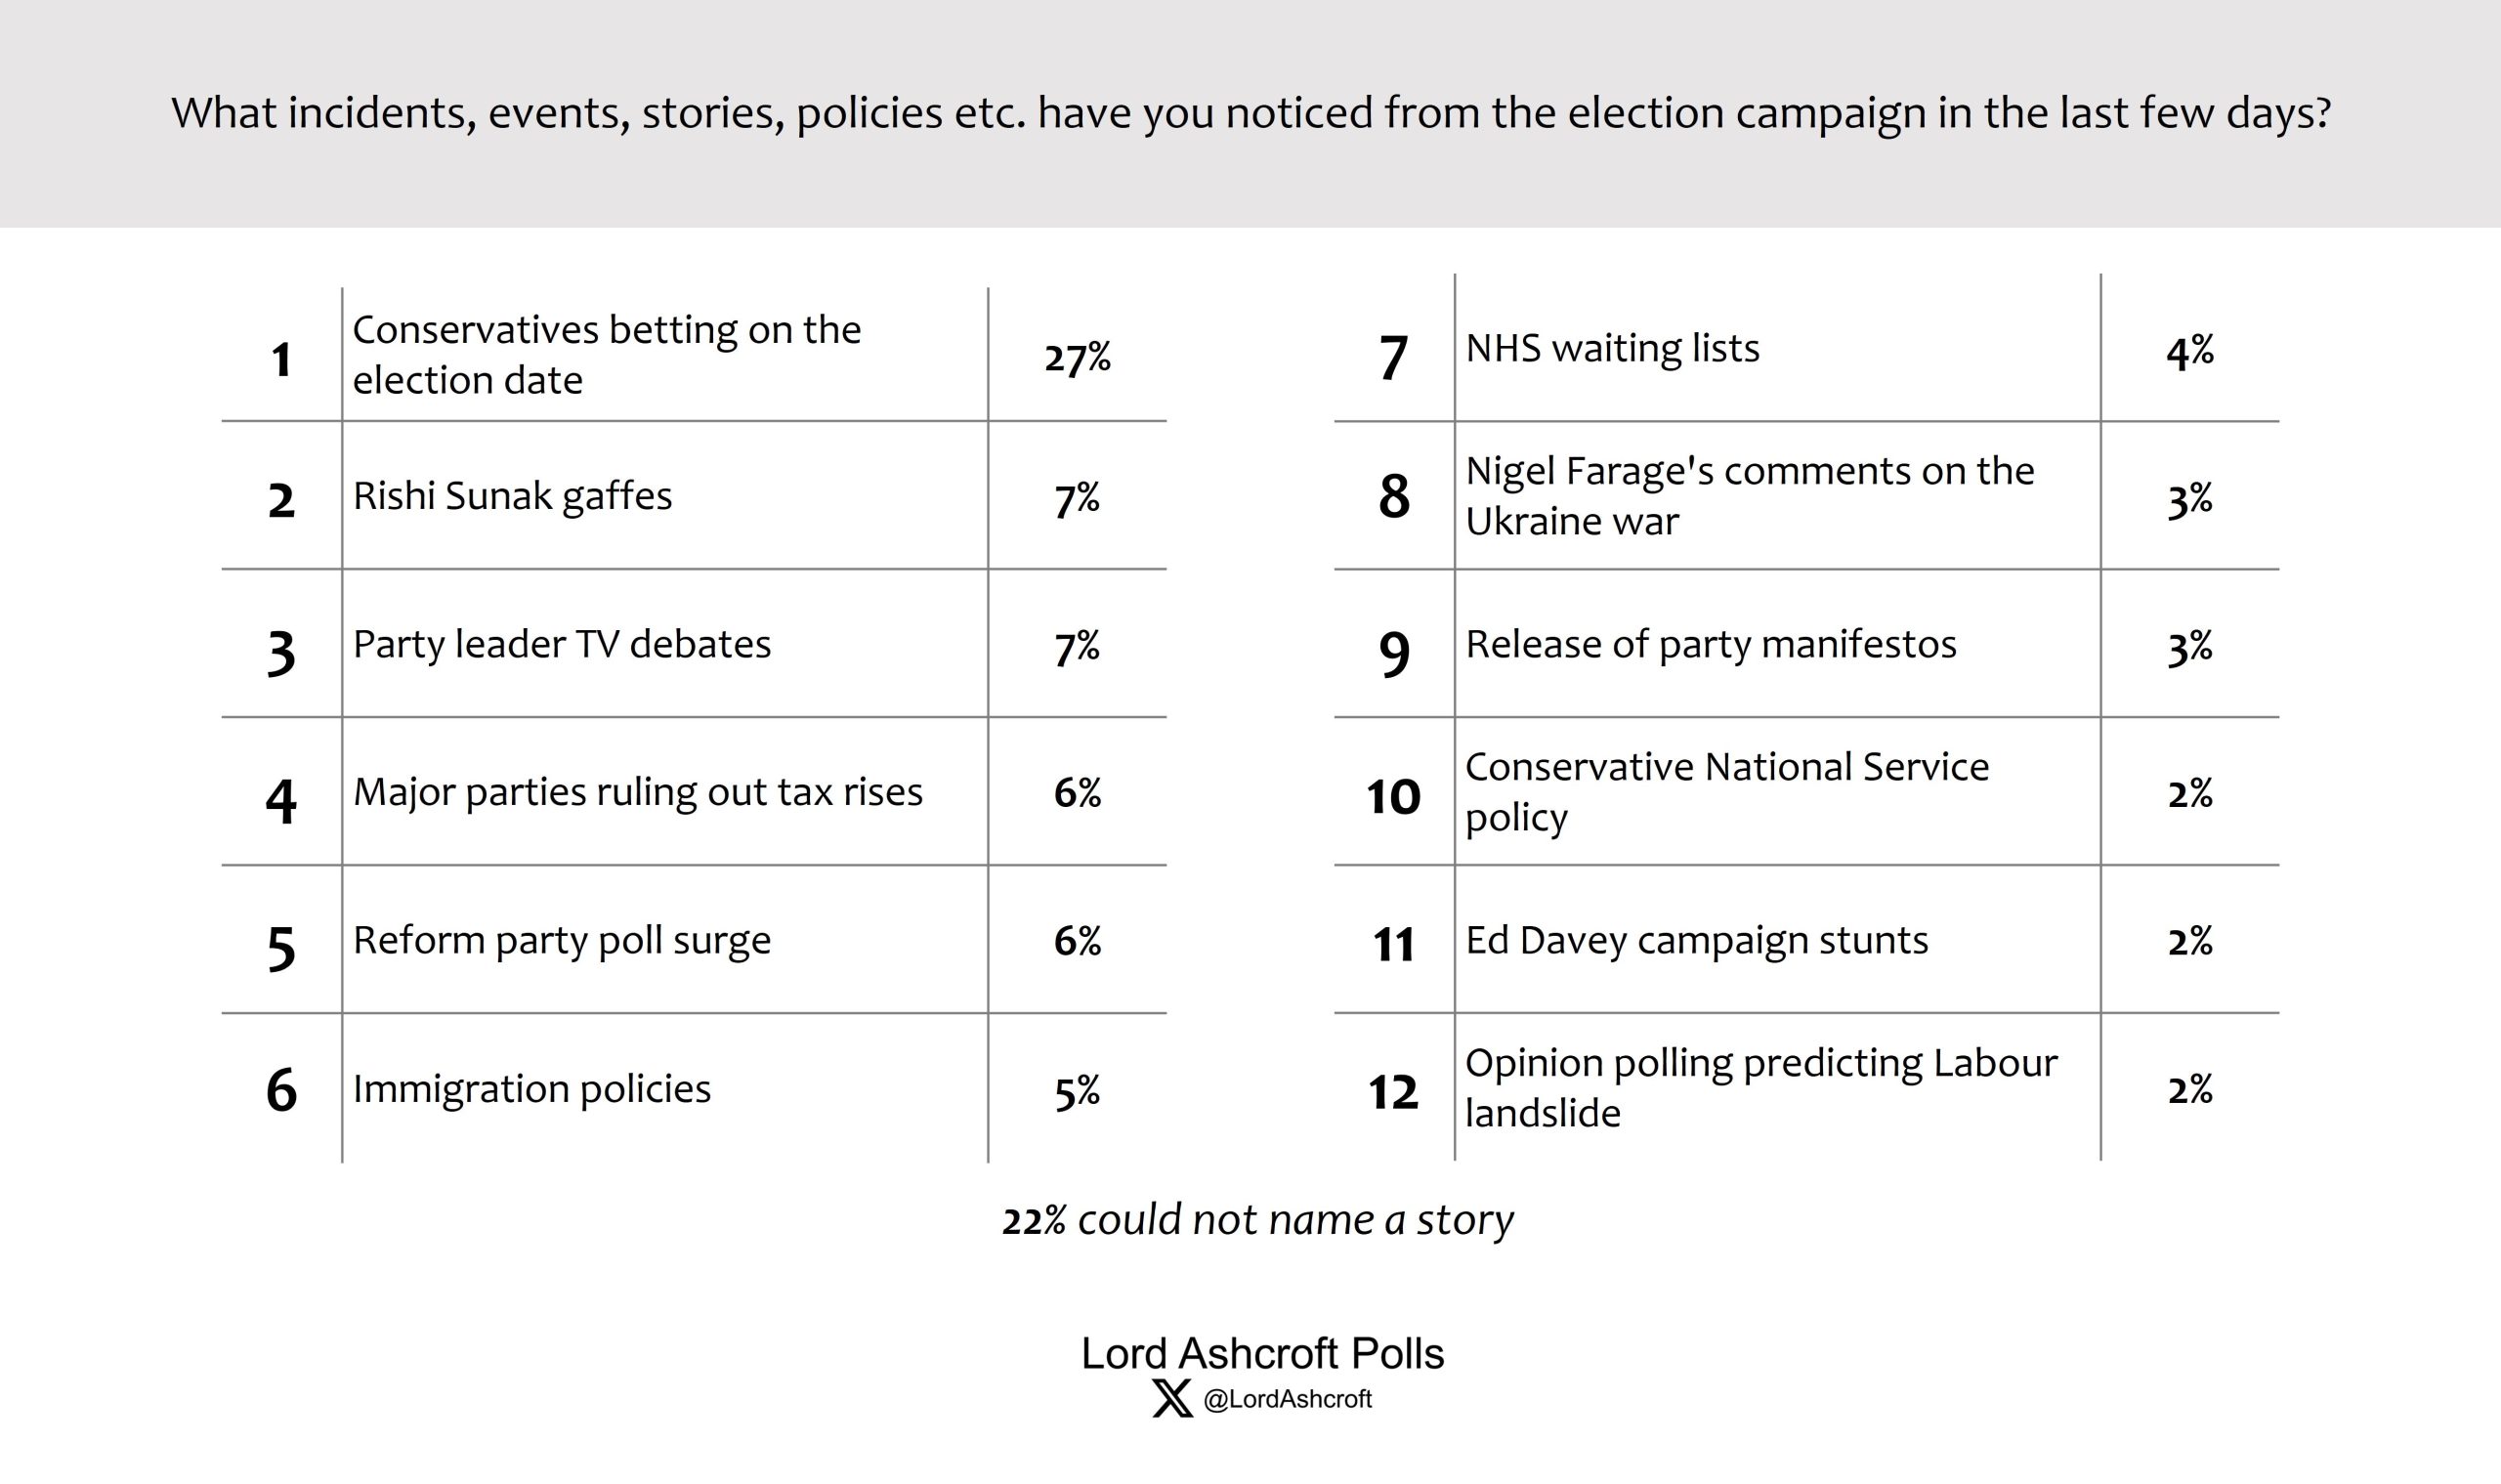
Conservatives betting on the election date was by far the most recalled election story of the last few days, and is in fact the most recalled story of any round of campaign polling – ahead of the Prime Minister leaving D-Day commemorations early and the Tories’ national service policy. ‘Rishi Sunak gaffes’ included D-Day, being deprived of Sky TV, and last week’s unsuccessful attempt to feed a sheep.
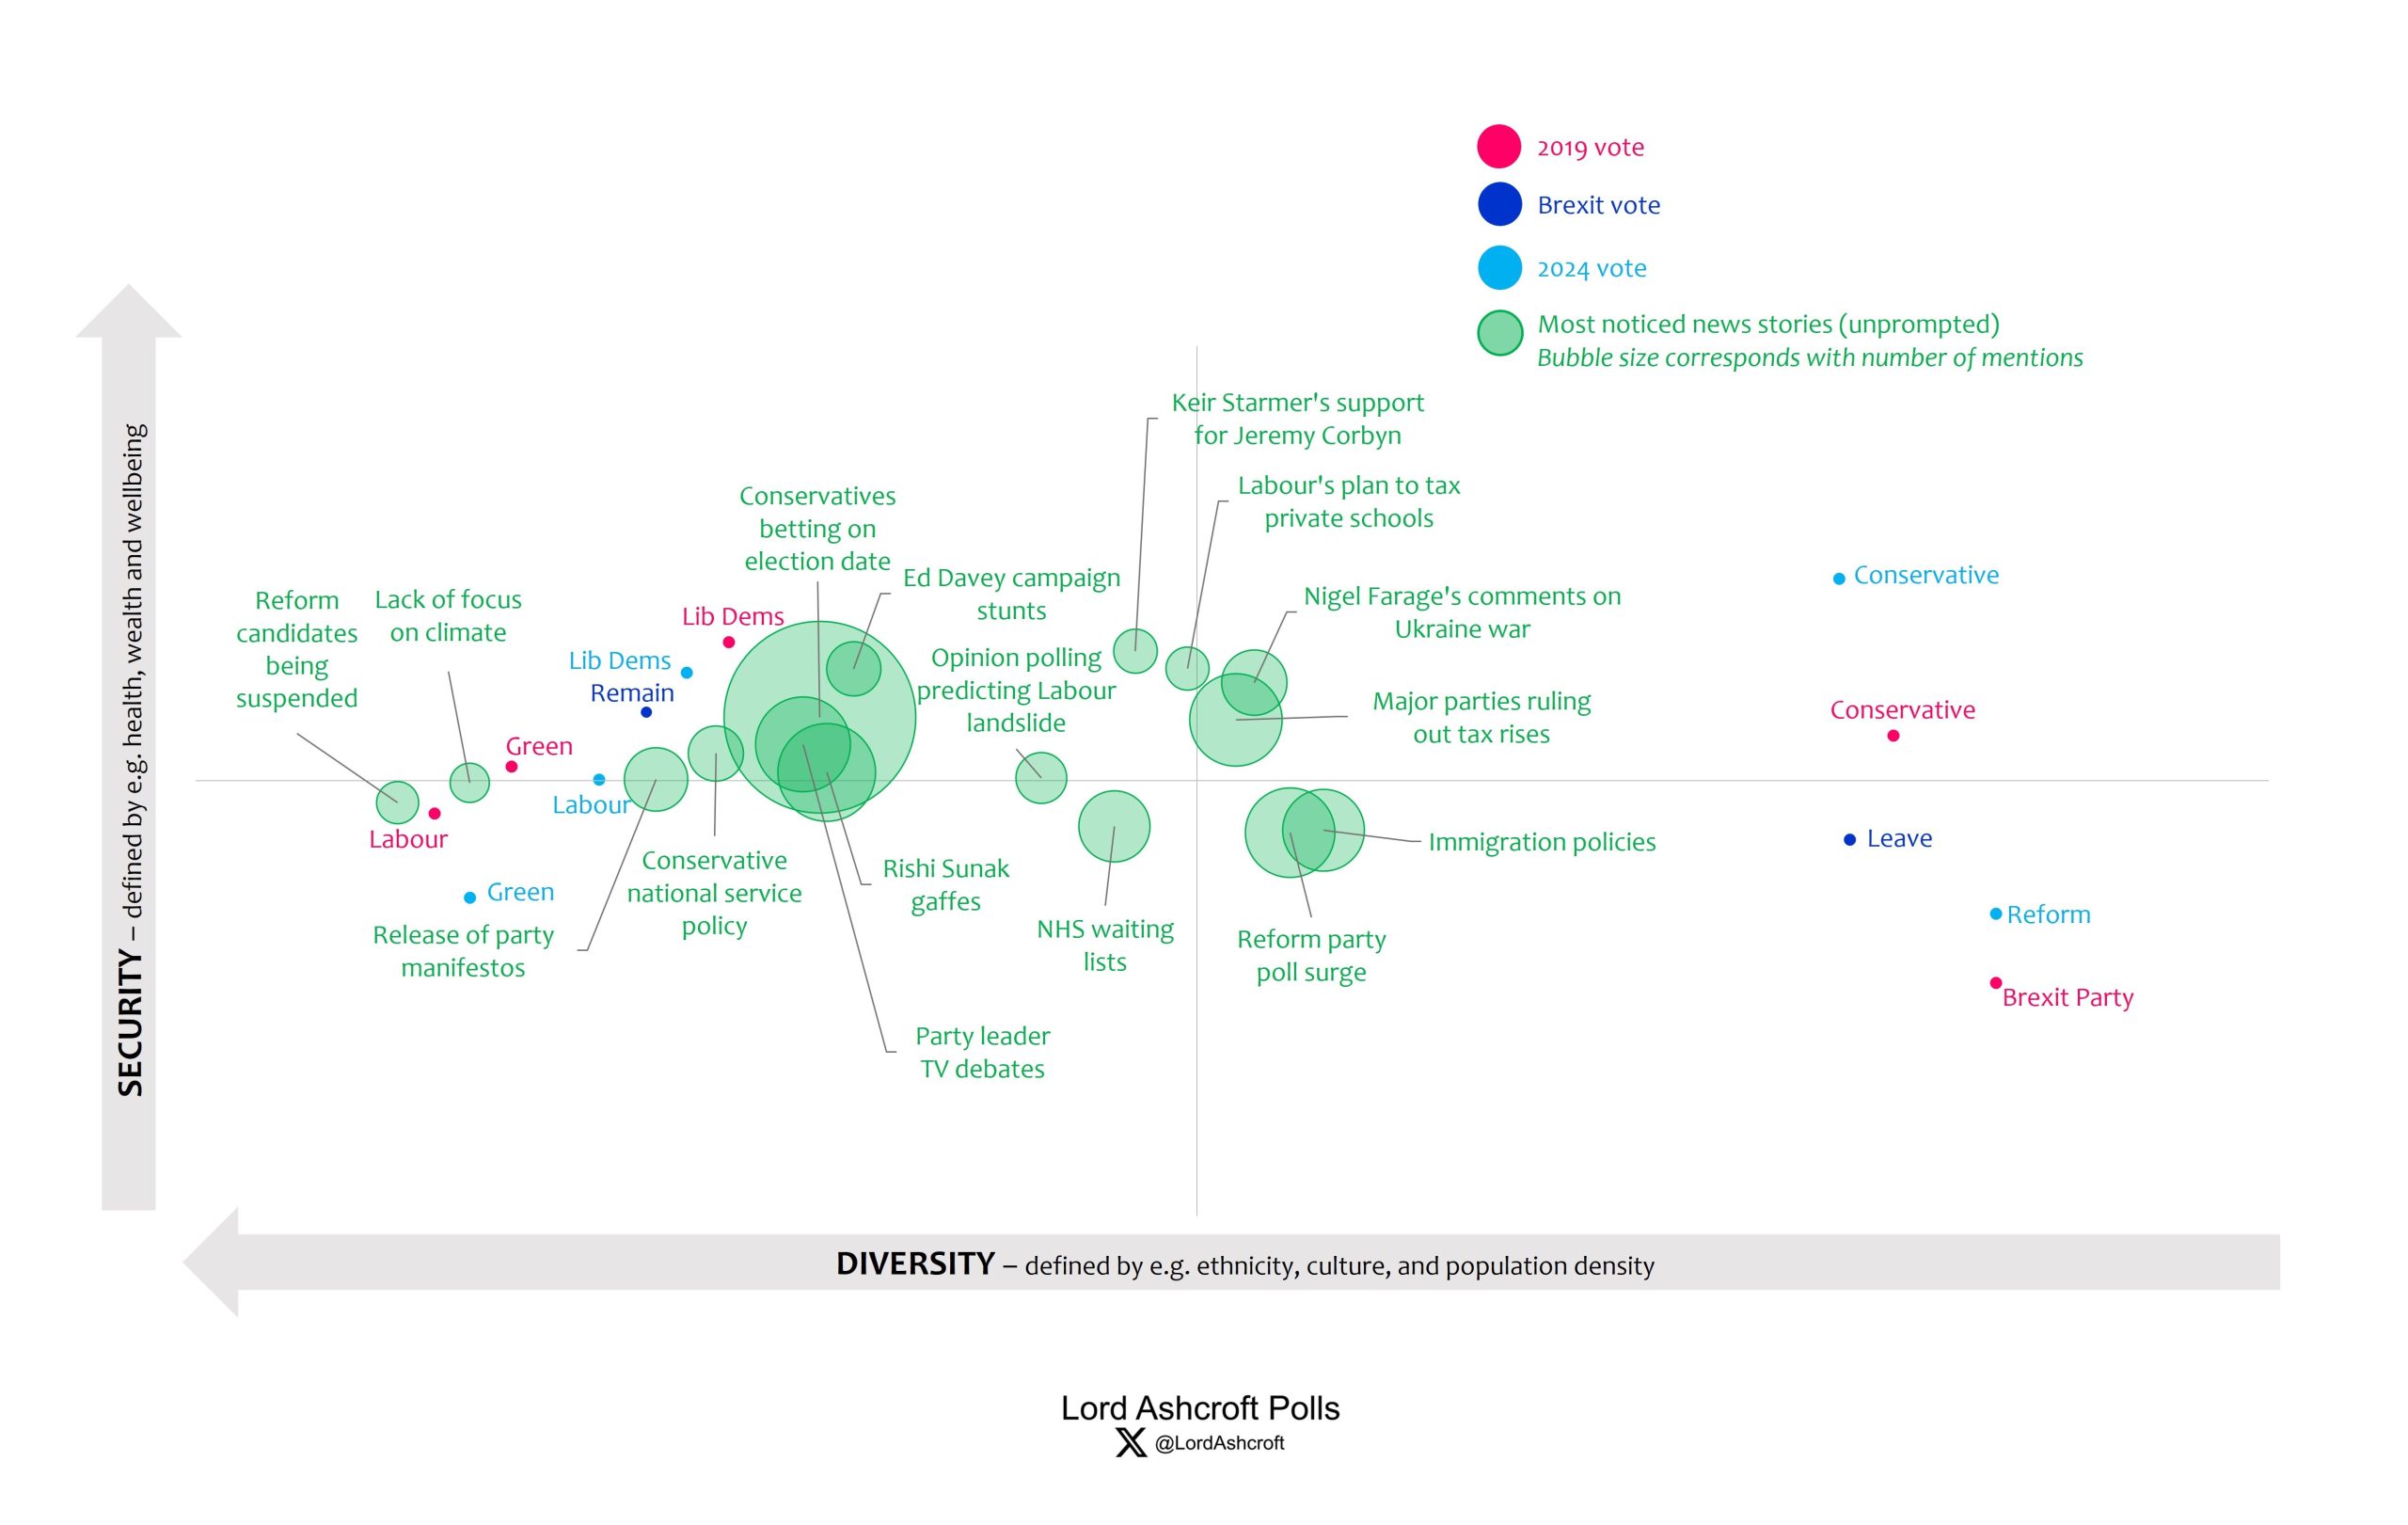
As we can see from our political map, the more diverse, left/liberal-leaning section of the electorate appears the most engaged in election coverage.
Few stories are most likely to have been noticed in the more Conservative-inclined right-hand side of the map, especially the less prosperous, Leave-voting bottom right – though stories about immigration and Reform UK were most likely to have been recalled by these voters.
Supermajority – and the new Opposition
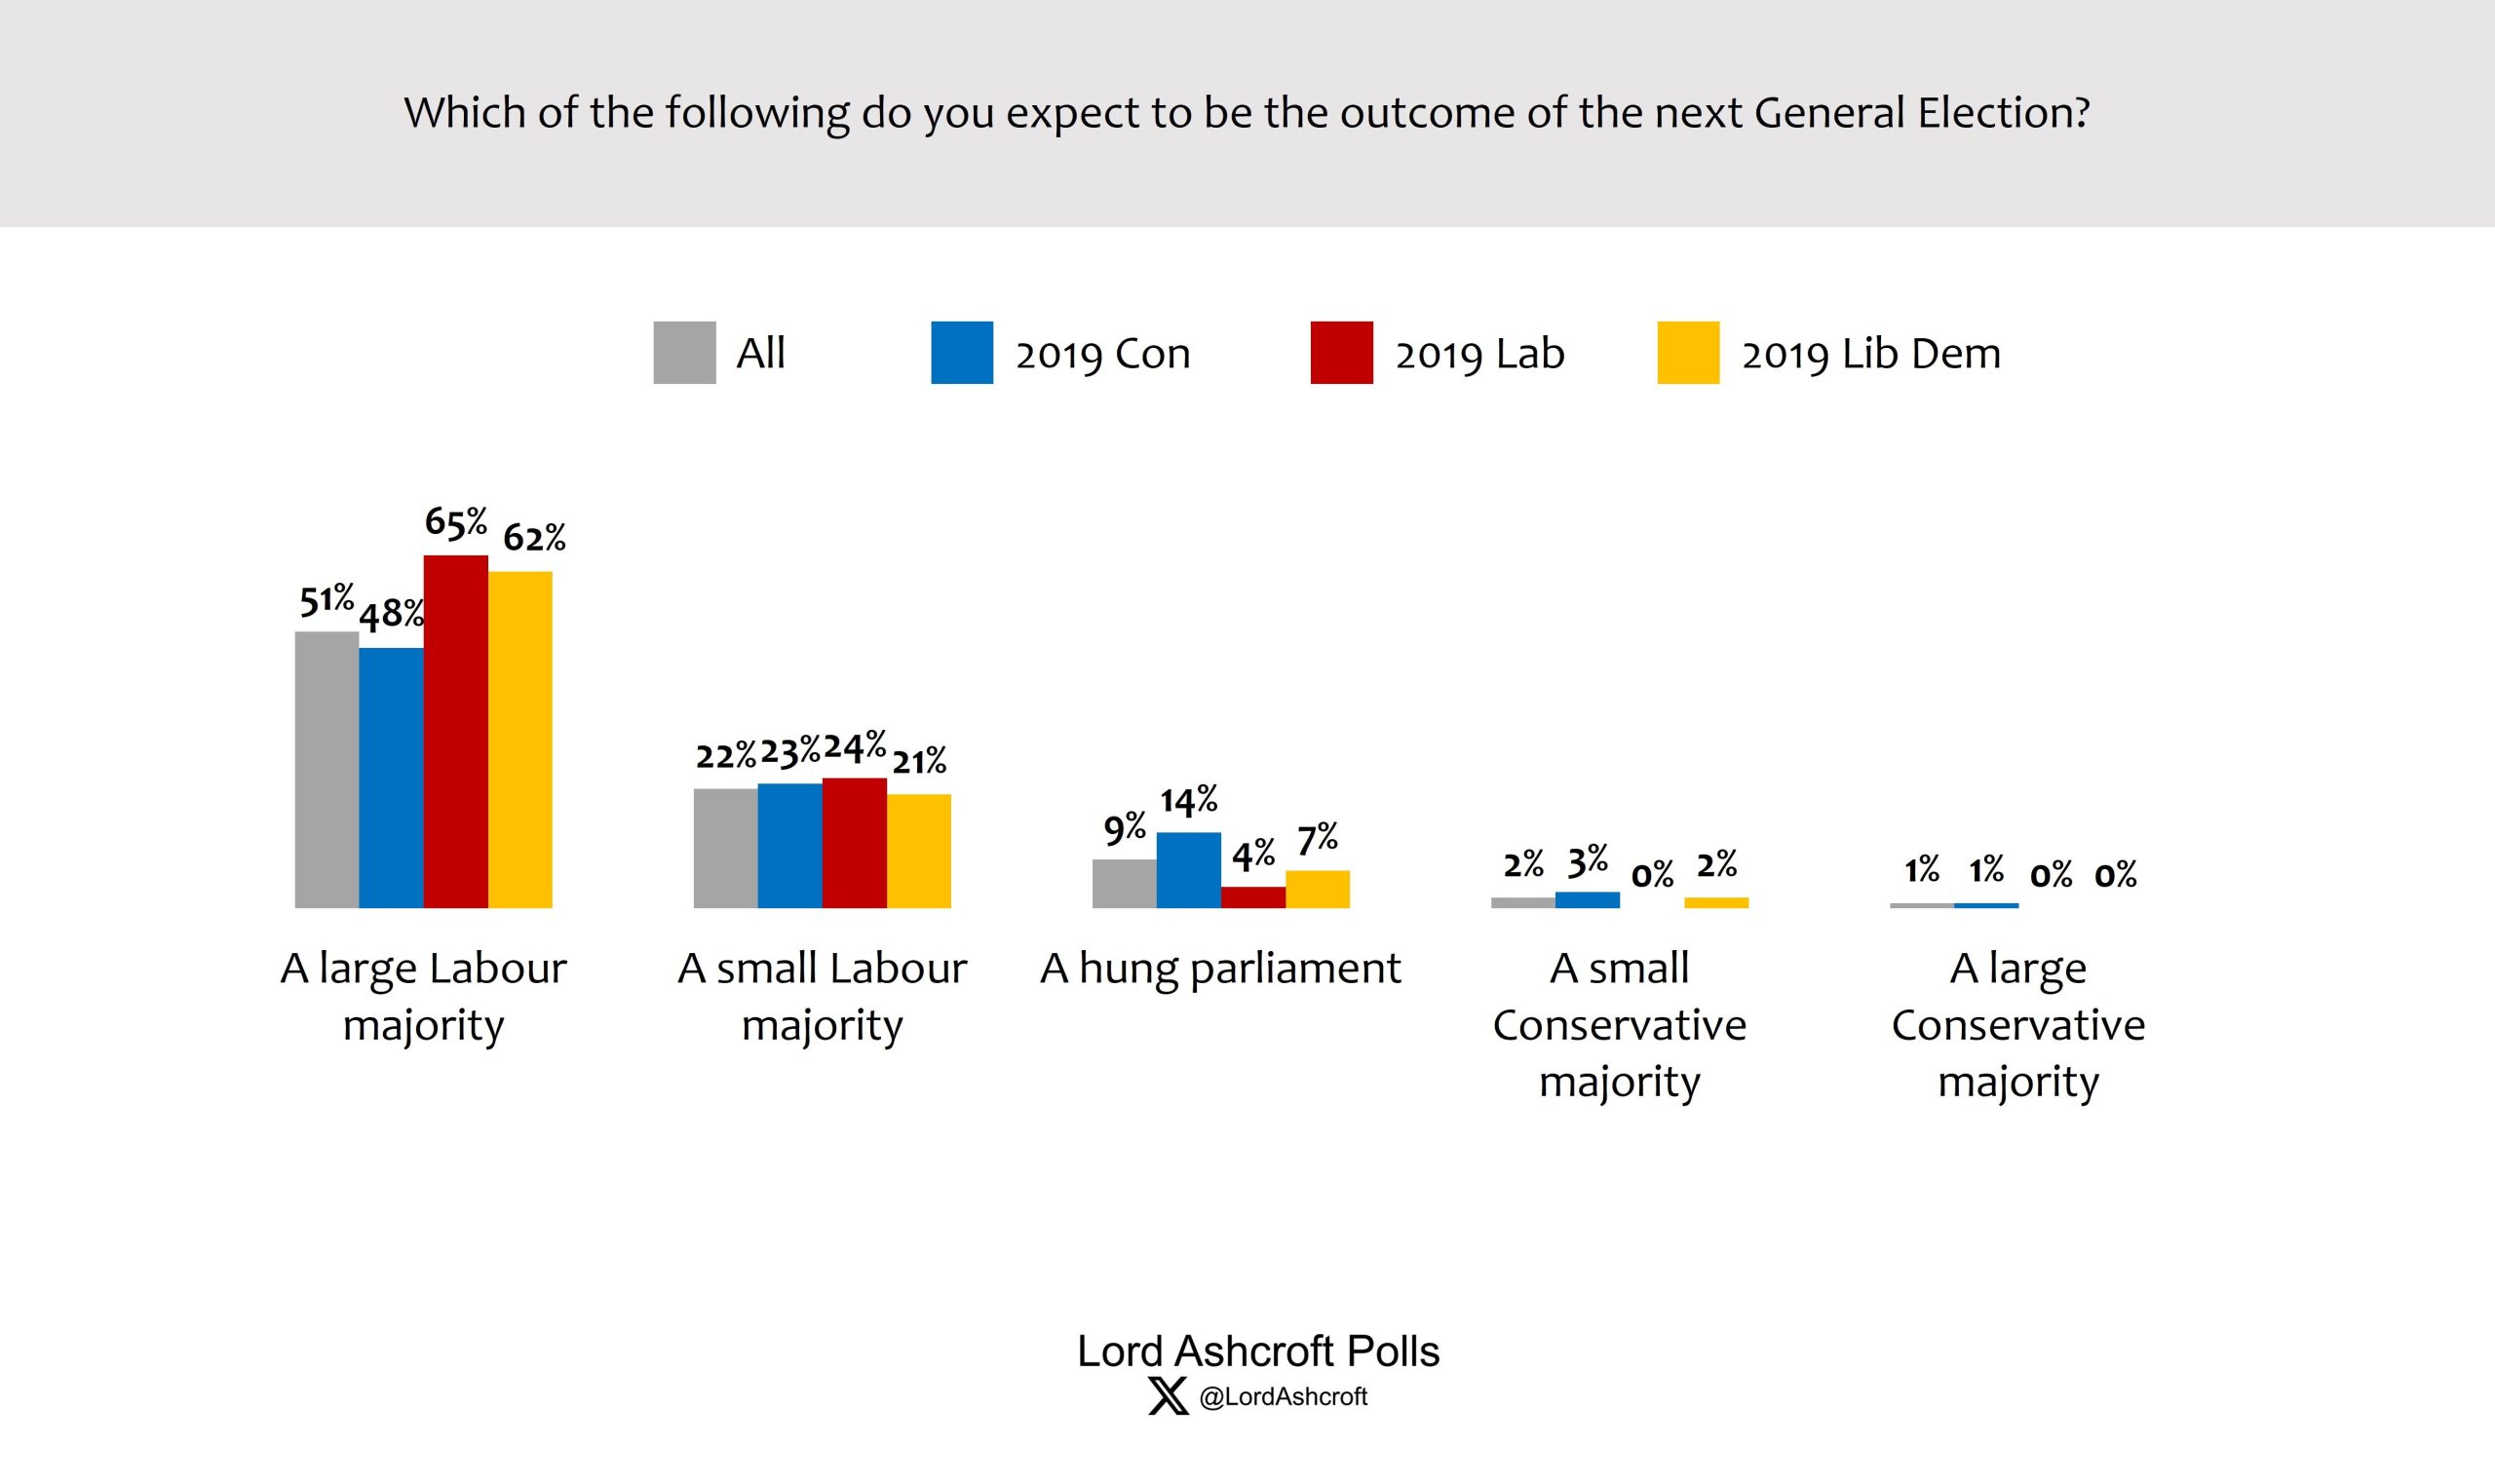
More than half (51 per cent) of all voters said they now expected the election to produce a large Labour majority – up from 35 per cent in the first week of the campaign. Nearly three quarters expected a Labour majority of some kind.
However, when we asked voters why they expected the result we did, two thirds (67 per cent) of those expecting a large Labour majority were much more likely than those expecting other results to say this was because “it’s what the polls and predictions in the news seem to say”.
Those expecting closer results were more likely to say this was based on their own intentions or from talking to colleagues, friends and family.

We also asked 2019 Conservative voters whether the idea of a large Labour majority made them more inclined to vote Tory again on 4 July to ensure the party survives and that there is a proper opposition to the new government.
Of these, 38 per cent said it would, but a majority said either that this would make no difference to how they voted (42 per cent) or that if the Tories were going to lose badly anyway, they might as well vote for another party (13 per cent).
Only 17 per cent of former Conservatives leaning towards Reform UK said the idea of a large Labour majority made them more likely to stick with the Tories, as did 35 per cent of 2019 Conservatives now saying they don’t know or won’t vote.

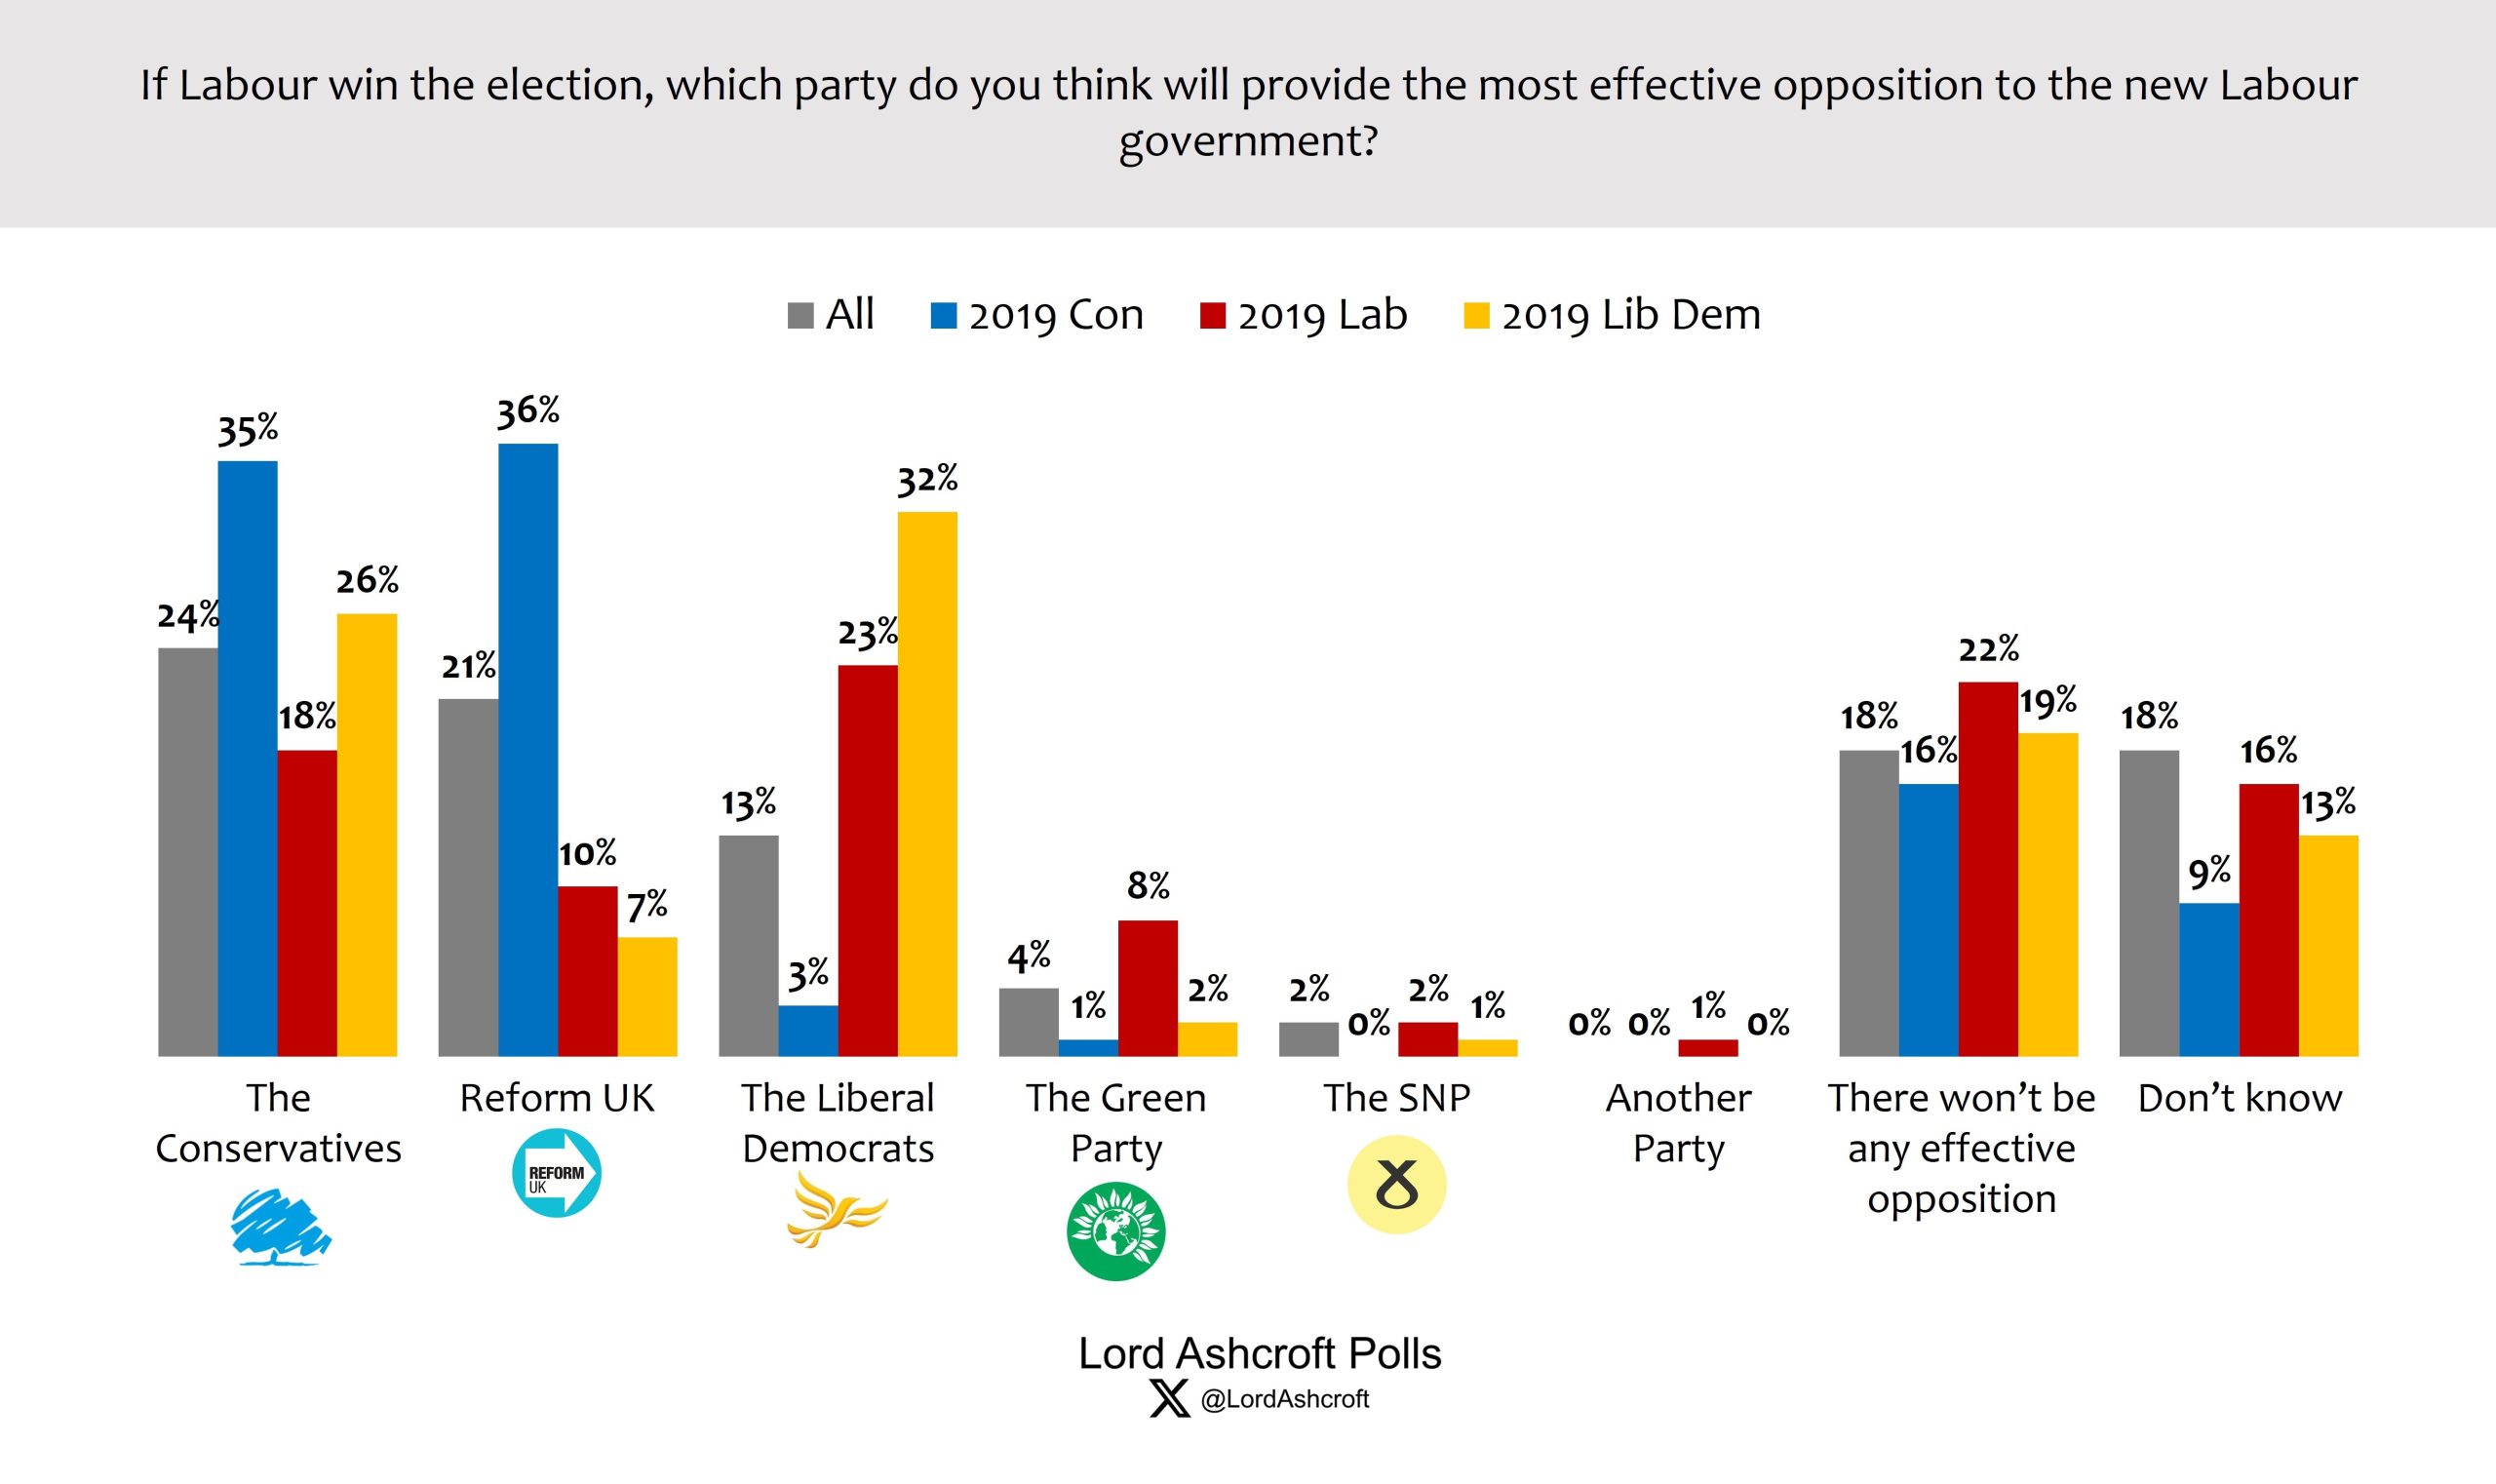
In the event of a Labour victory, voters were slightly more likely to think the Conservatives would provide the most effective opposition (24 per cent) than Reform UK (21 per cent). 2019 Tories were fractionally more likely to think Reform would do the better job (36 per cent) than the Conservative Party (35 per cent).
Nearly one in five voters overall (18 per cent) thought there would be no effective opposition.
Green Belt
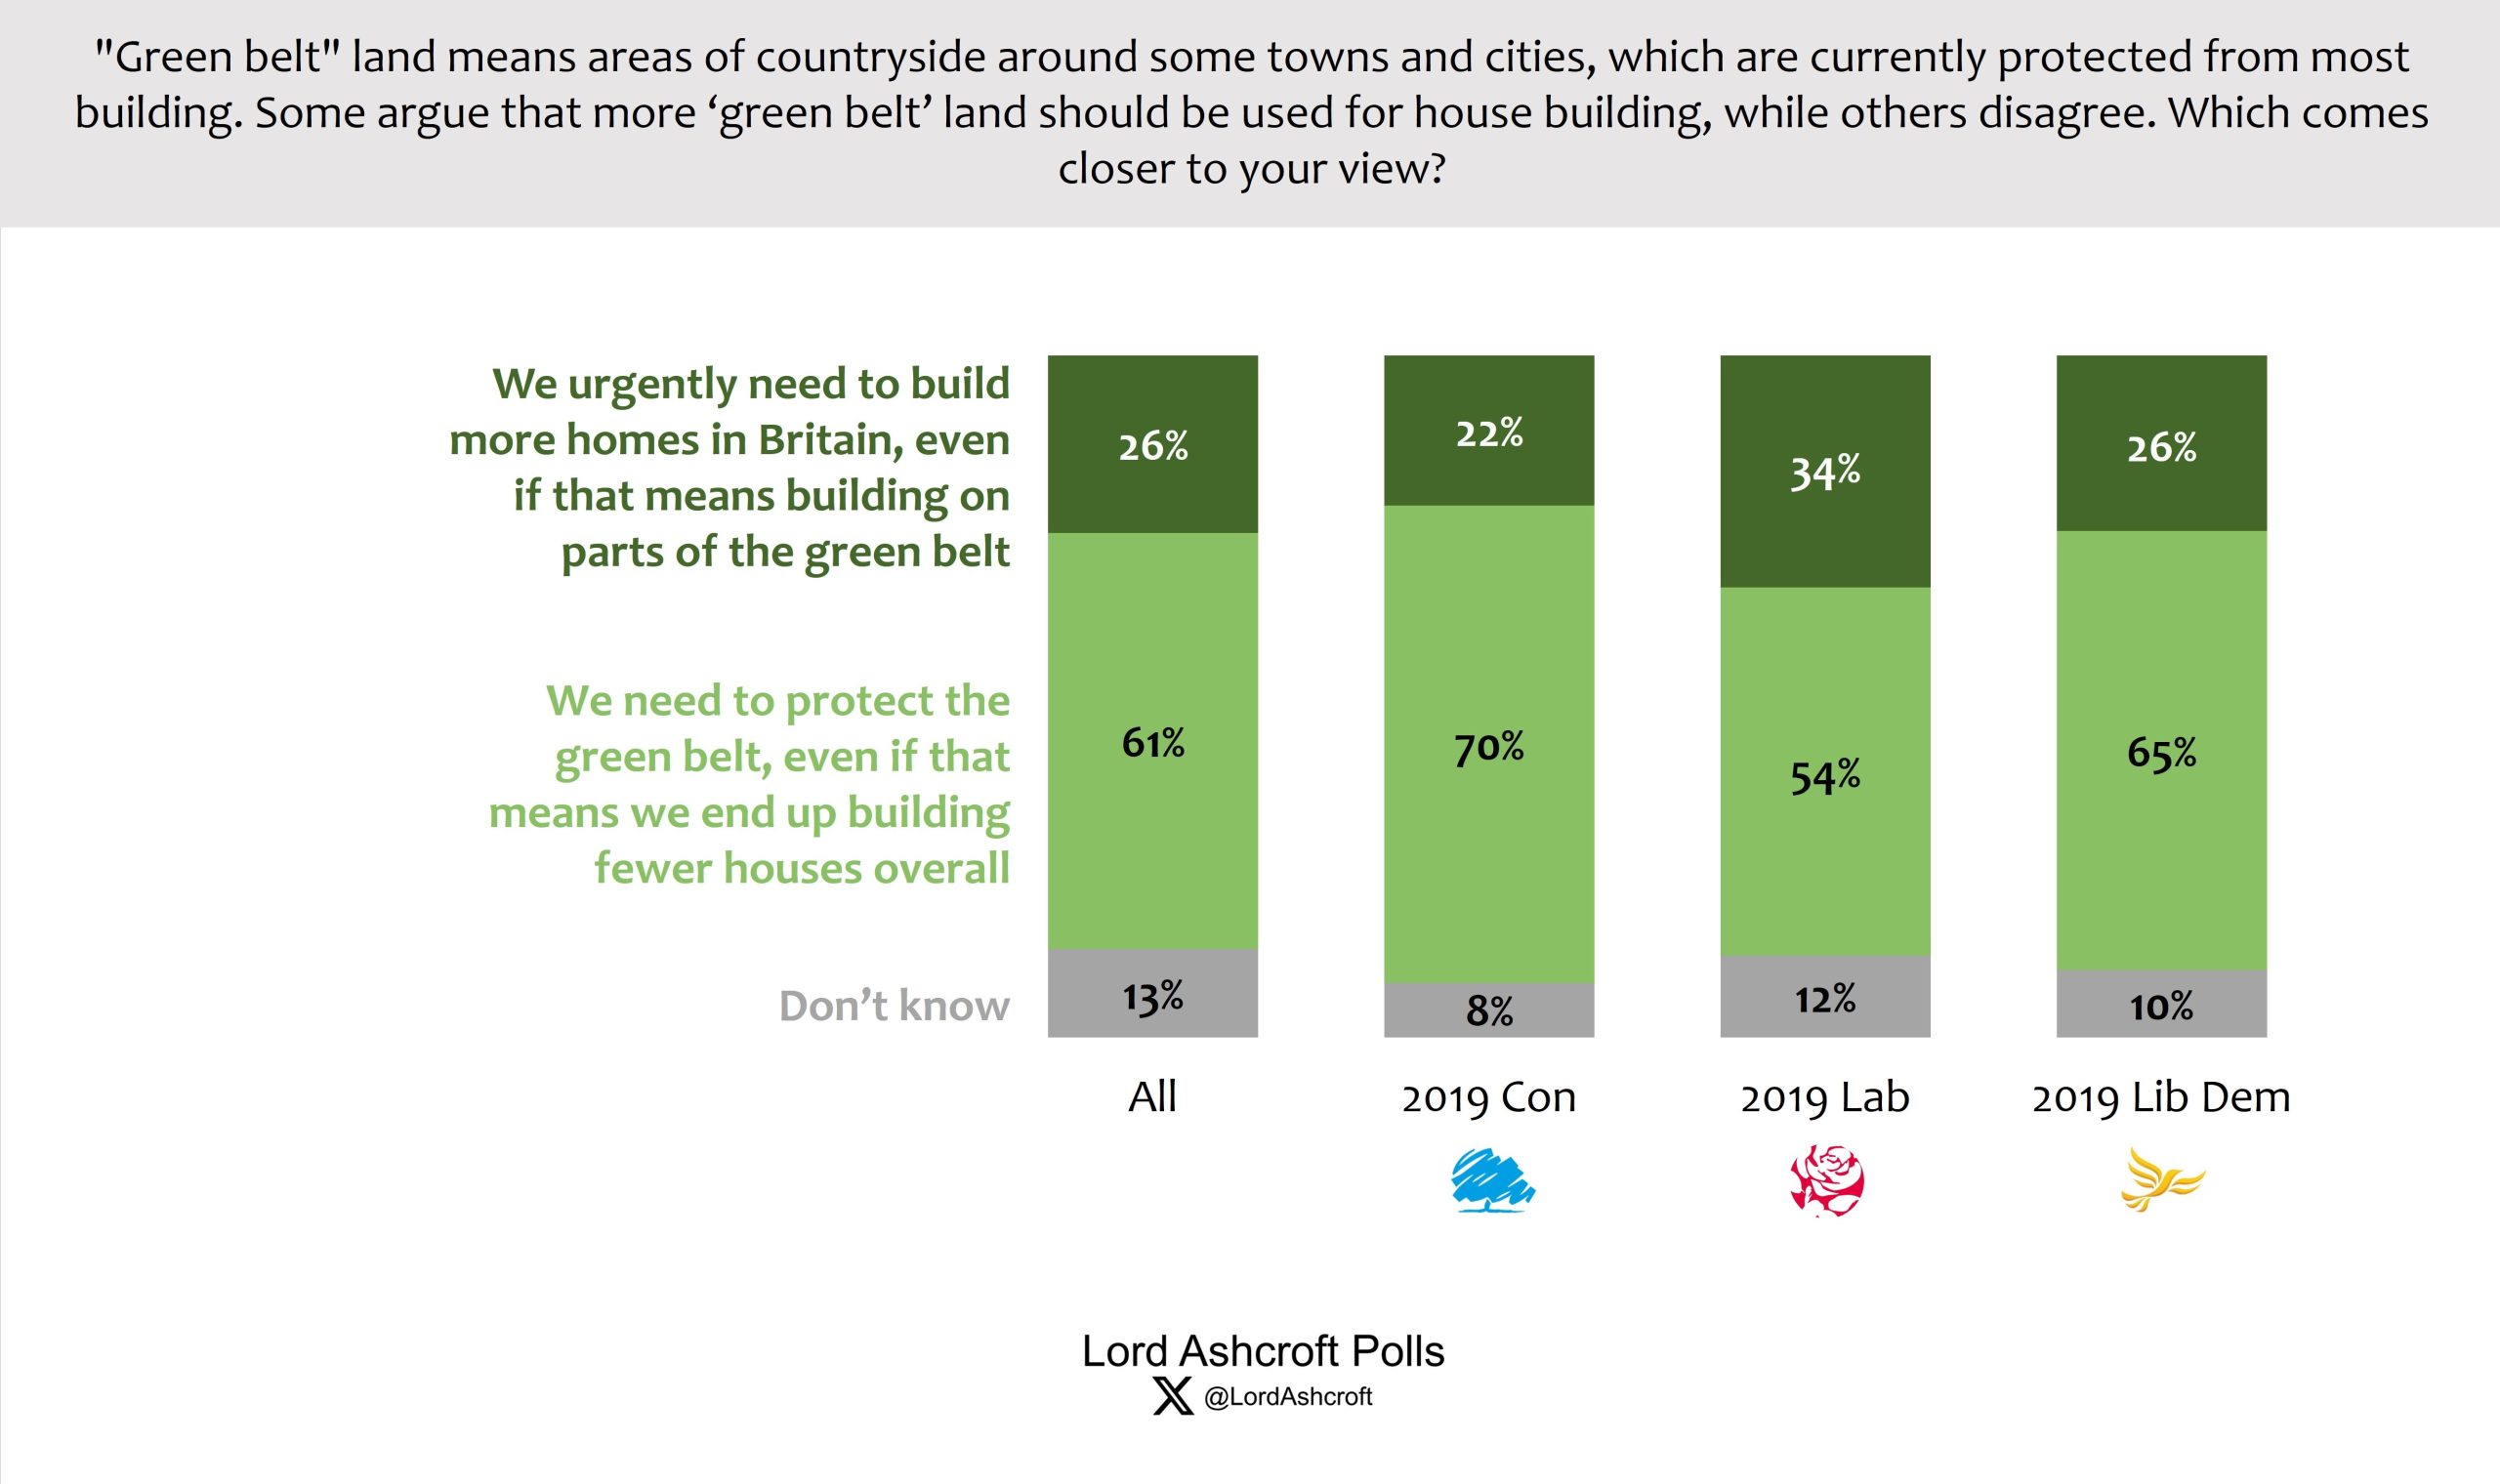
Following Sir Keir Starmer’s cautious remarks about building on the Green Belt, and reported less cautious remarks from an anonymous Labour adviser that they should “flatten the green belt” to build more houses, we found only just over a quarter (26 per cent) agreeing that “we urgently need to build more homes in Britain, even if that means building on parts of the green belt”.
More than six in ten, including a majority of both former and current likely Labour voters, agreed with the alternative statement “we need to protect the green belt, even if that means we end up building fewer houses overall.”
The main players
We asked how positive or negative people felt about a selection of prominent politicians from different parties.
No individual had a net positive score, but Rachel Reeves came the closest with a net -1 (though 42 per cent said they didn’t know enough about her to have a view). Arguably the most popular (or least unpopular) well-known politician was Angela Rayner, with a net score of -6 and only 29 per cent saying they didn’t know enough to say.
Ed Davey was the highest-scoring leader with -5, compared to -14 for Keir Starmer, -31 for Nigel Farage and -50 for Rishi Sunak.

The economy
With inflation back down to 2 per cent, we asked people whether or not they thought the economy was improving when it came to things like prices, jobs, wages and living standards, and how far they were willing to put this down to the government.

Overall, just over four in ten (41 per cent) said they thought things were starting to improve, but only half of these (21 per cent, and just under half of 2019 Tories) said the Government deserved some credit for this. However, the 49 per cent who said things were not improving yet were overwhelming likely to say this was largely the government’s fault.
The Reform factor

Among voters as a whole, we found just 24 per cent saying they were interested in the ideas and policies of Farage and Reform UK would consider voting for them – suggesting that their current ceiling is around a quarter of the electorate (though this rises to 46 per cent among 2019 Conservative voters).
A further 16 per cent, including another quarter of 2019 Tories, say they couldn’t see themselves voting for Reform but they like the way their policies and ideas challenge the more established parties.
Among likely Conservative voters, just over six in ten say either that they could see themselves voting Reform (22 per cent) or that they like the fact that they are around (39 per cent), while just over one third (35 per cent) say they are not interested and wish they were not part of British politics.
Those Tory prime ministers in full
When we asked people to order the five Conservative prime ministers since 2010 from best to worst, David Cameron was most often ranked first.
However, he owed this position largely to non-Conservative voters – 2019 Tories were most likely to choose Boris Johnson (42 per cent), followed by Cameron (27 per cent). More than half (51 per cent) of likely Reform UK voters ranked Johnson first, with 17 per cent naming Cameron.

The fundamentals
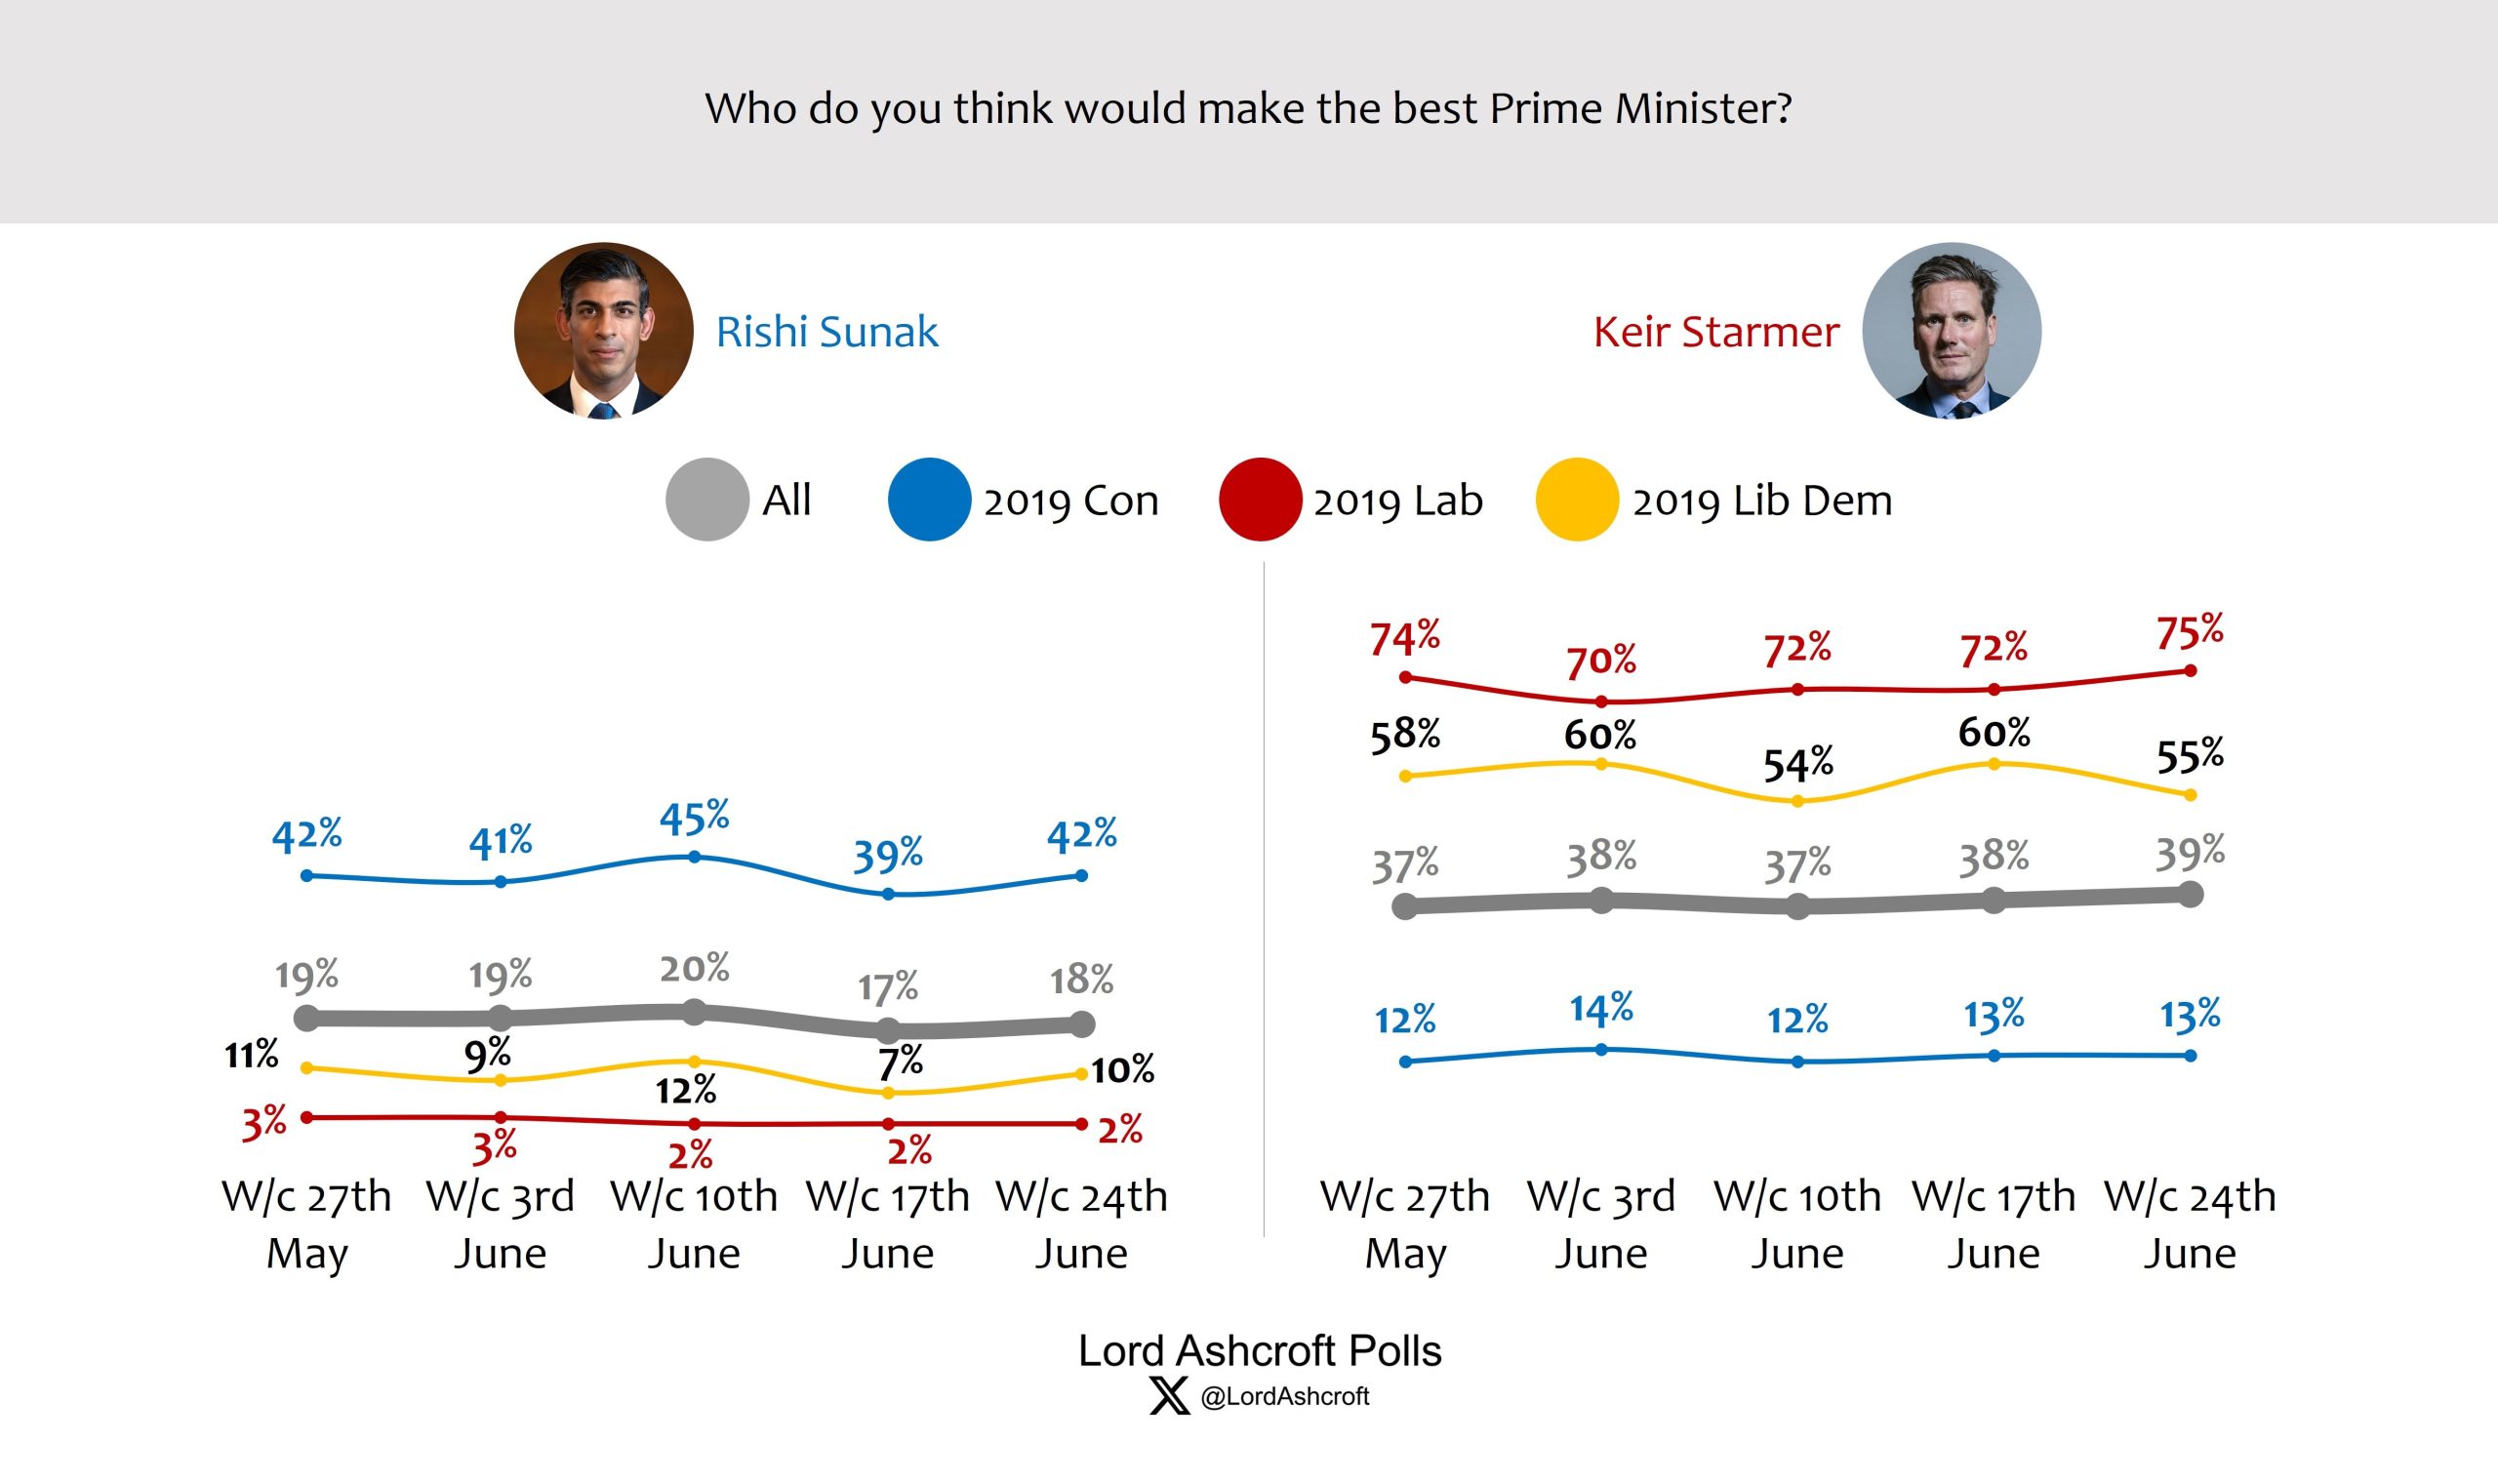
Starmer’s lead over Sunak as best prime minister remains unchanged since last week at 21 points, with 43 per cent saying “don’t know”. 2019 Tories who say they don’t know or won’t vote prefer Sunak to Starmer by 23 points (33 per cent to ten per cent), compared to 16 points last week (29 per cent to 13 per cent).
Voters currently leaning towards Reform UK preferred Sunak over Starmer by 24 per cent to eight per cent, with 68 per cent saying “don’t know”. On the question of who would do the better job running the British economy, the Labour team’s lead is also unchanged since last week’s survey.
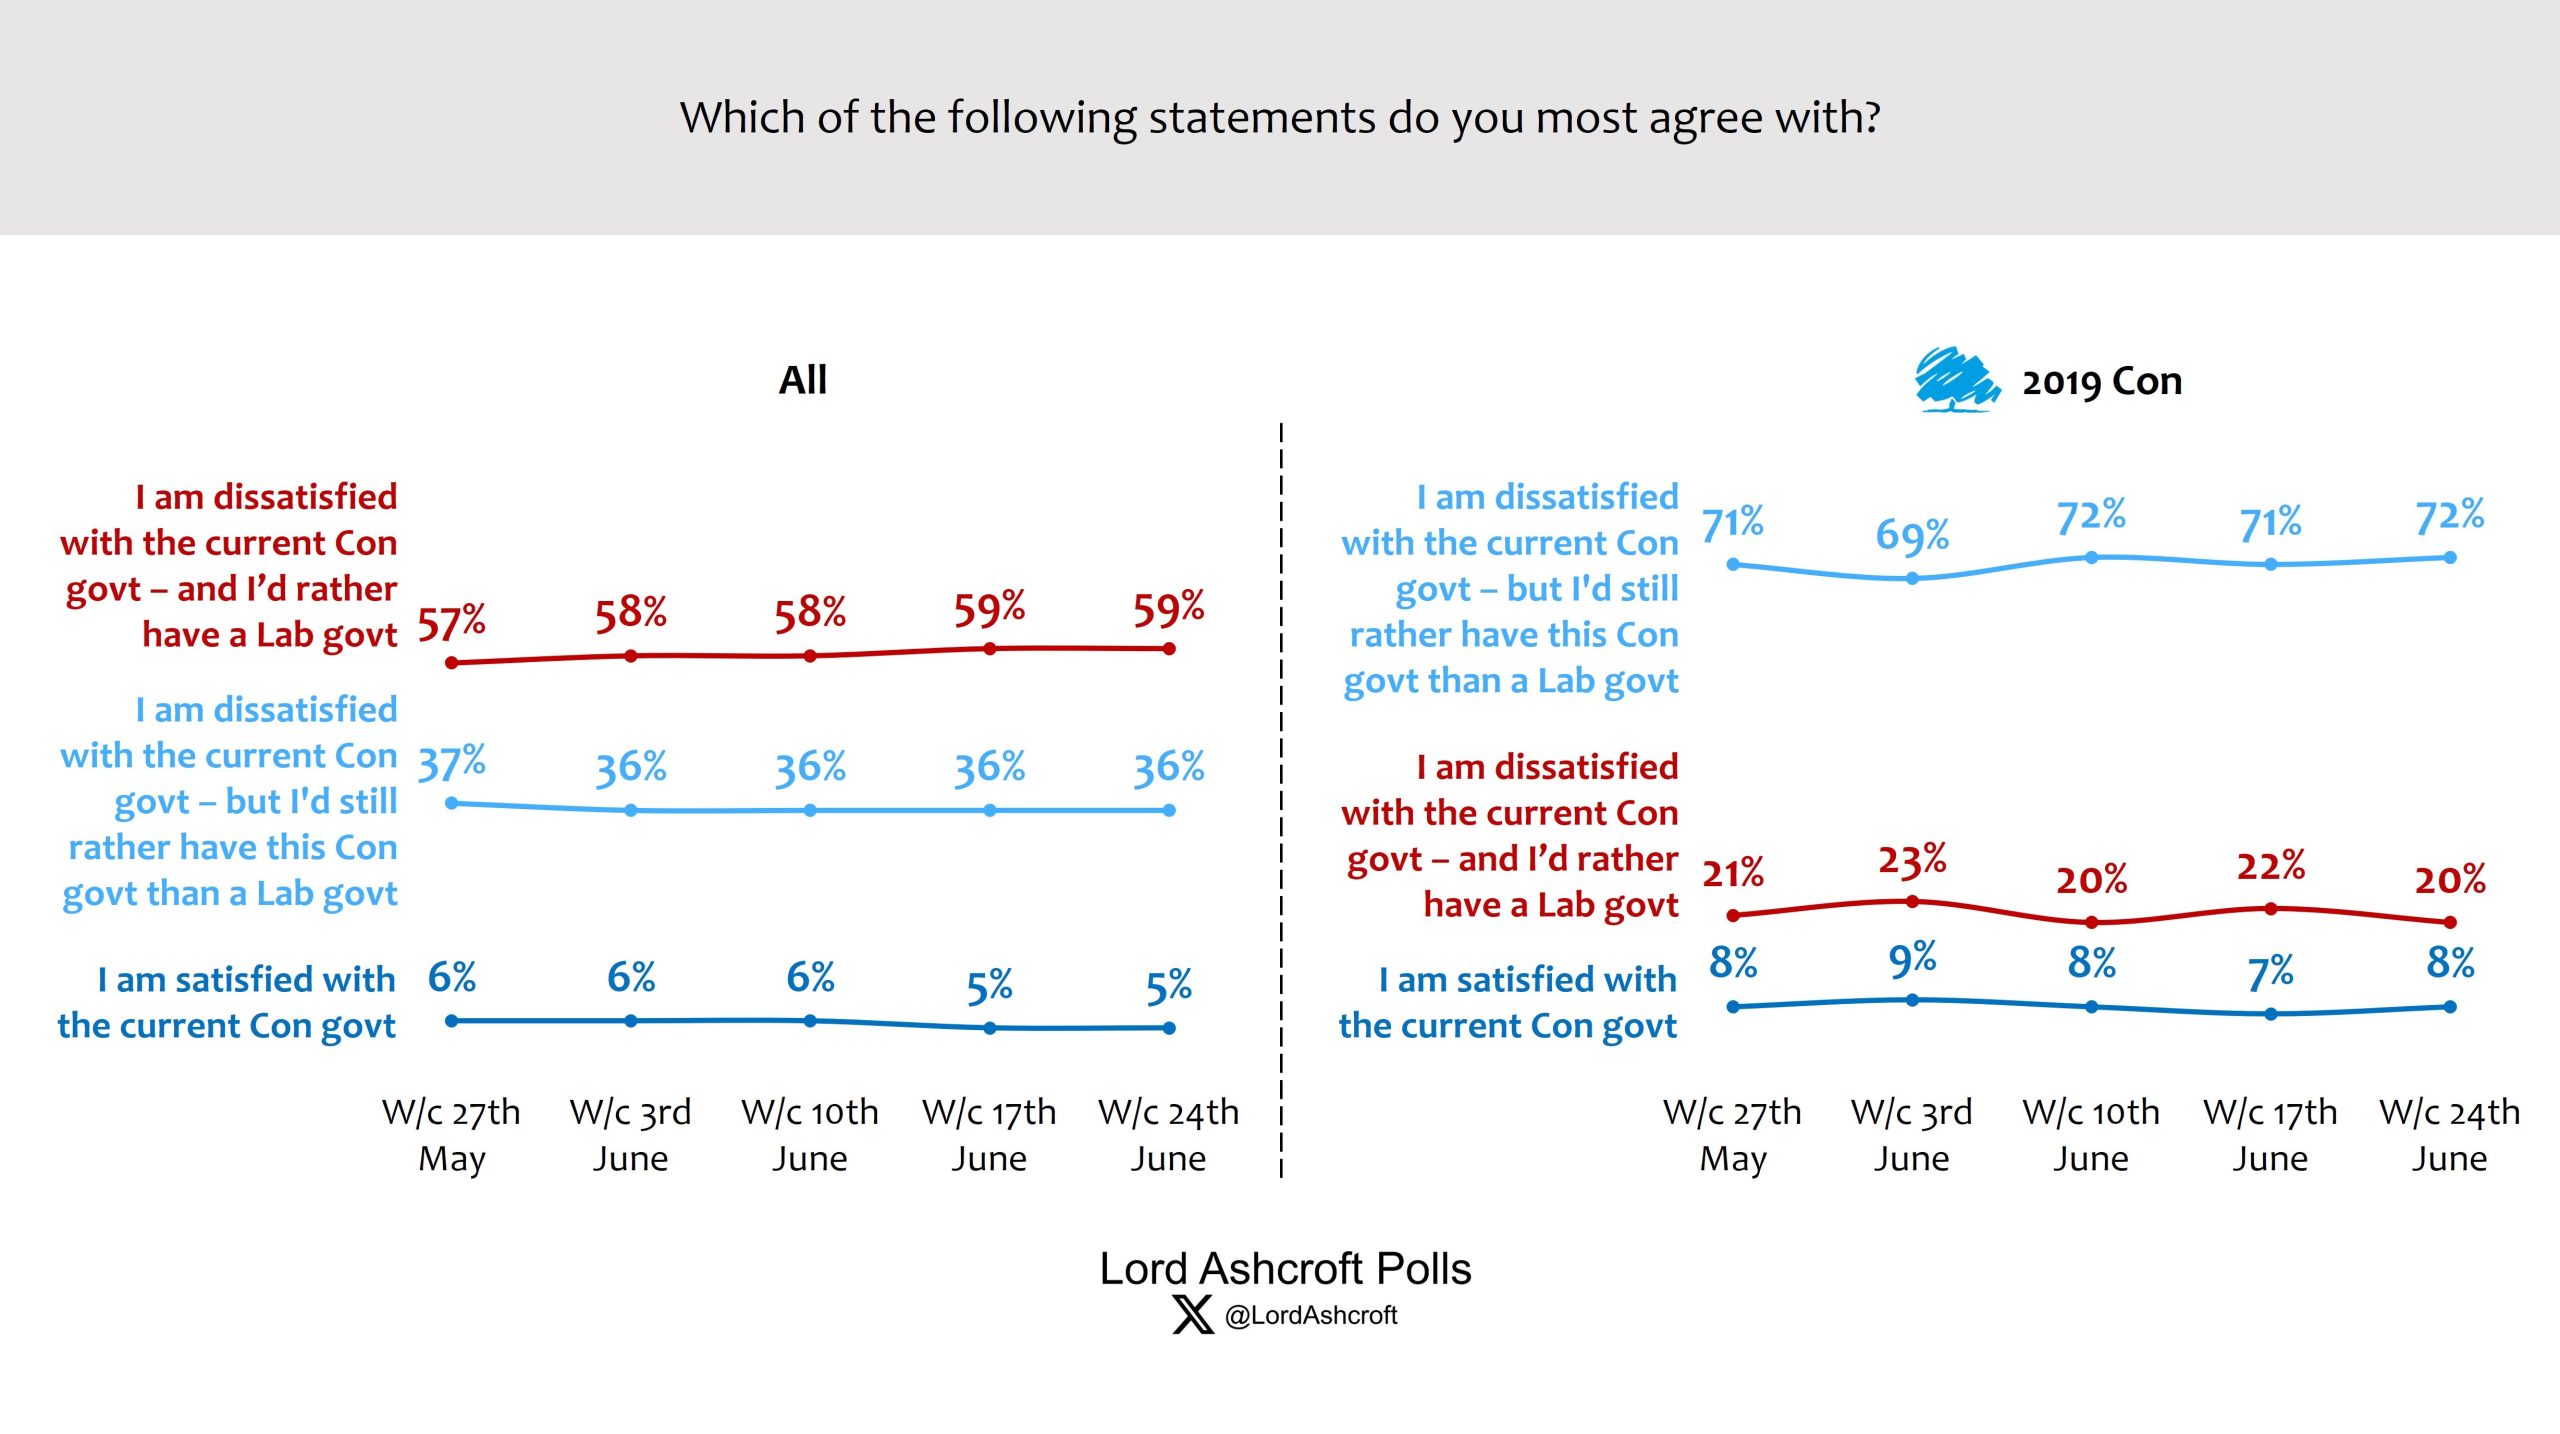
The proportion of voters saying they are satisfied with the current government remains unchanged since last week at one in 20. This includes eight per cent of those who voted Conservative in 2019.
However, 81 per cent of 2019 Tories who say they don’t know or won’t vote say they prefer a Conservative government to a Labour one, as do 84 per cent of 2019 Tories currently leaning towards Reform UK.
Voting likelihood

Among 2019 Tories, the mean likelihood of voting Conservative again on 4 July was 39/100, up two points from last week’s low of 37.
Taking only those who put their chances of voting for their most likely party at 50/100 or above, we find 40 per cent saying they are currently most likely to vote Labour, 19 per cent Conservative, 17 per cent Reform UK and ten per cent Lib Dem. This compares to last week’s figures of Labour on 43 per cent and the Conservatives and Reform both with 18 per cent.

At the same time, only half of all voters say they have definitely decided what they are going to do on 4 July. Those leaning towards Labour were the most likely to say they had made up their minds (72 per cent).
Those currently intending to back Reform UK were more likely to say this (67 per cent) than those leaning towards the Conservatives (63 per cent) or the Lib Dems (59 per cent).
The political map

Our political map shows how different issues, attributes, personalities and opinions interact with one another. Each point shows where we are most likely to find people with that characteristic or opinion; the closer the plot points are to each other the more closely related they are.
Here we see the distribution of favourability towards different political personalities – in particular, whether prominent Conservatives are most likely to be seen positively in the more prosperous traditional Tory top-right quadrant, or in the less secure, Leave-voting bottom right where Conservative support has collapsed since many voted for the party for the first time in 2019.
We also see that those most likely to think the economy is improving are in the already better-off top half of the map, and of those, the view that the government deserves some credit are in the most Tory-supporting territory.
Full data available at LordAshcroftPolls.com.
Lord Ashcroft KCMG PC is an international businessman, philanthropist, author, and pollster. For more information on his work, visit lordashcroft.com.
The betting scandal was the most noticed election story in recent days, according to my latest campaign poll – which also finds that most Labour voters oppose building on the green belt, that 2019 Tories are divided as to whether the Conservatives or Reform would be the most effective opposition to a new Labour government, and that most former Tories are not swayed by arguments about a Labour ‘supermajority’.
What have people noticed?
Conservatives betting on the election date was by far the most recalled election story of the last few days, and is in fact the most recalled story of any round of campaign polling – ahead of the Prime Minister leaving D-Day commemorations early and the Tories’ national service policy. ‘Rishi Sunak gaffes’ included D-Day, being deprived of Sky TV, and last week’s unsuccessful attempt to feed a sheep.
As we can see from our political map, the more diverse, left/liberal-leaning section of the electorate appears the most engaged in election coverage.
Few stories are most likely to have been noticed in the more Conservative-inclined right-hand side of the map, especially the less prosperous, Leave-voting bottom right – though stories about immigration and Reform UK were most likely to have been recalled by these voters.
Supermajority – and the new Opposition
More than half (51 per cent) of all voters said they now expected the election to produce a large Labour majority – up from 35 per cent in the first week of the campaign. Nearly three quarters expected a Labour majority of some kind.
However, when we asked voters why they expected the result we did, two thirds (67 per cent) of those expecting a large Labour majority were much more likely than those expecting other results to say this was because “it’s what the polls and predictions in the news seem to say”.
Those expecting closer results were more likely to say this was based on their own intentions or from talking to colleagues, friends and family.
We also asked 2019 Conservative voters whether the idea of a large Labour majority made them more inclined to vote Tory again on 4 July to ensure the party survives and that there is a proper opposition to the new government.
Of these, 38 per cent said it would, but a majority said either that this would make no difference to how they voted (42 per cent) or that if the Tories were going to lose badly anyway, they might as well vote for another party (13 per cent).
Only 17 per cent of former Conservatives leaning towards Reform UK said the idea of a large Labour majority made them more likely to stick with the Tories, as did 35 per cent of 2019 Conservatives now saying they don’t know or won’t vote.
In the event of a Labour victory, voters were slightly more likely to think the Conservatives would provide the most effective opposition (24 per cent) than Reform UK (21 per cent). 2019 Tories were fractionally more likely to think Reform would do the better job (36 per cent) than the Conservative Party (35 per cent).
Nearly one in five voters overall (18 per cent) thought there would be no effective opposition.
Green Belt
Following Sir Keir Starmer’s cautious remarks about building on the Green Belt, and reported less cautious remarks from an anonymous Labour adviser that they should “flatten the green belt” to build more houses, we found only just over a quarter (26 per cent) agreeing that “we urgently need to build more homes in Britain, even if that means building on parts of the green belt”.
More than six in ten, including a majority of both former and current likely Labour voters, agreed with the alternative statement “we need to protect the green belt, even if that means we end up building fewer houses overall.”
The main players
We asked how positive or negative people felt about a selection of prominent politicians from different parties.
No individual had a net positive score, but Rachel Reeves came the closest with a net -1 (though 42 per cent said they didn’t know enough about her to have a view). Arguably the most popular (or least unpopular) well-known politician was Angela Rayner, with a net score of -6 and only 29 per cent saying they didn’t know enough to say.
Ed Davey was the highest-scoring leader with -5, compared to -14 for Keir Starmer, -31 for Nigel Farage and -50 for Rishi Sunak.
The economy
With inflation back down to 2 per cent, we asked people whether or not they thought the economy was improving when it came to things like prices, jobs, wages and living standards, and how far they were willing to put this down to the government.
Overall, just over four in ten (41 per cent) said they thought things were starting to improve, but only half of these (21 per cent, and just under half of 2019 Tories) said the Government deserved some credit for this. However, the 49 per cent who said things were not improving yet were overwhelming likely to say this was largely the government’s fault.
The Reform factor
Among voters as a whole, we found just 24 per cent saying they were interested in the ideas and policies of Farage and Reform UK would consider voting for them – suggesting that their current ceiling is around a quarter of the electorate (though this rises to 46 per cent among 2019 Conservative voters).
A further 16 per cent, including another quarter of 2019 Tories, say they couldn’t see themselves voting for Reform but they like the way their policies and ideas challenge the more established parties.
Among likely Conservative voters, just over six in ten say either that they could see themselves voting Reform (22 per cent) or that they like the fact that they are around (39 per cent), while just over one third (35 per cent) say they are not interested and wish they were not part of British politics.
Those Tory prime ministers in full
When we asked people to order the five Conservative prime ministers since 2010 from best to worst, David Cameron was most often ranked first.
However, he owed this position largely to non-Conservative voters – 2019 Tories were most likely to choose Boris Johnson (42 per cent), followed by Cameron (27 per cent). More than half (51 per cent) of likely Reform UK voters ranked Johnson first, with 17 per cent naming Cameron.
The fundamentals
Starmer’s lead over Sunak as best prime minister remains unchanged since last week at 21 points, with 43 per cent saying “don’t know”. 2019 Tories who say they don’t know or won’t vote prefer Sunak to Starmer by 23 points (33 per cent to ten per cent), compared to 16 points last week (29 per cent to 13 per cent).
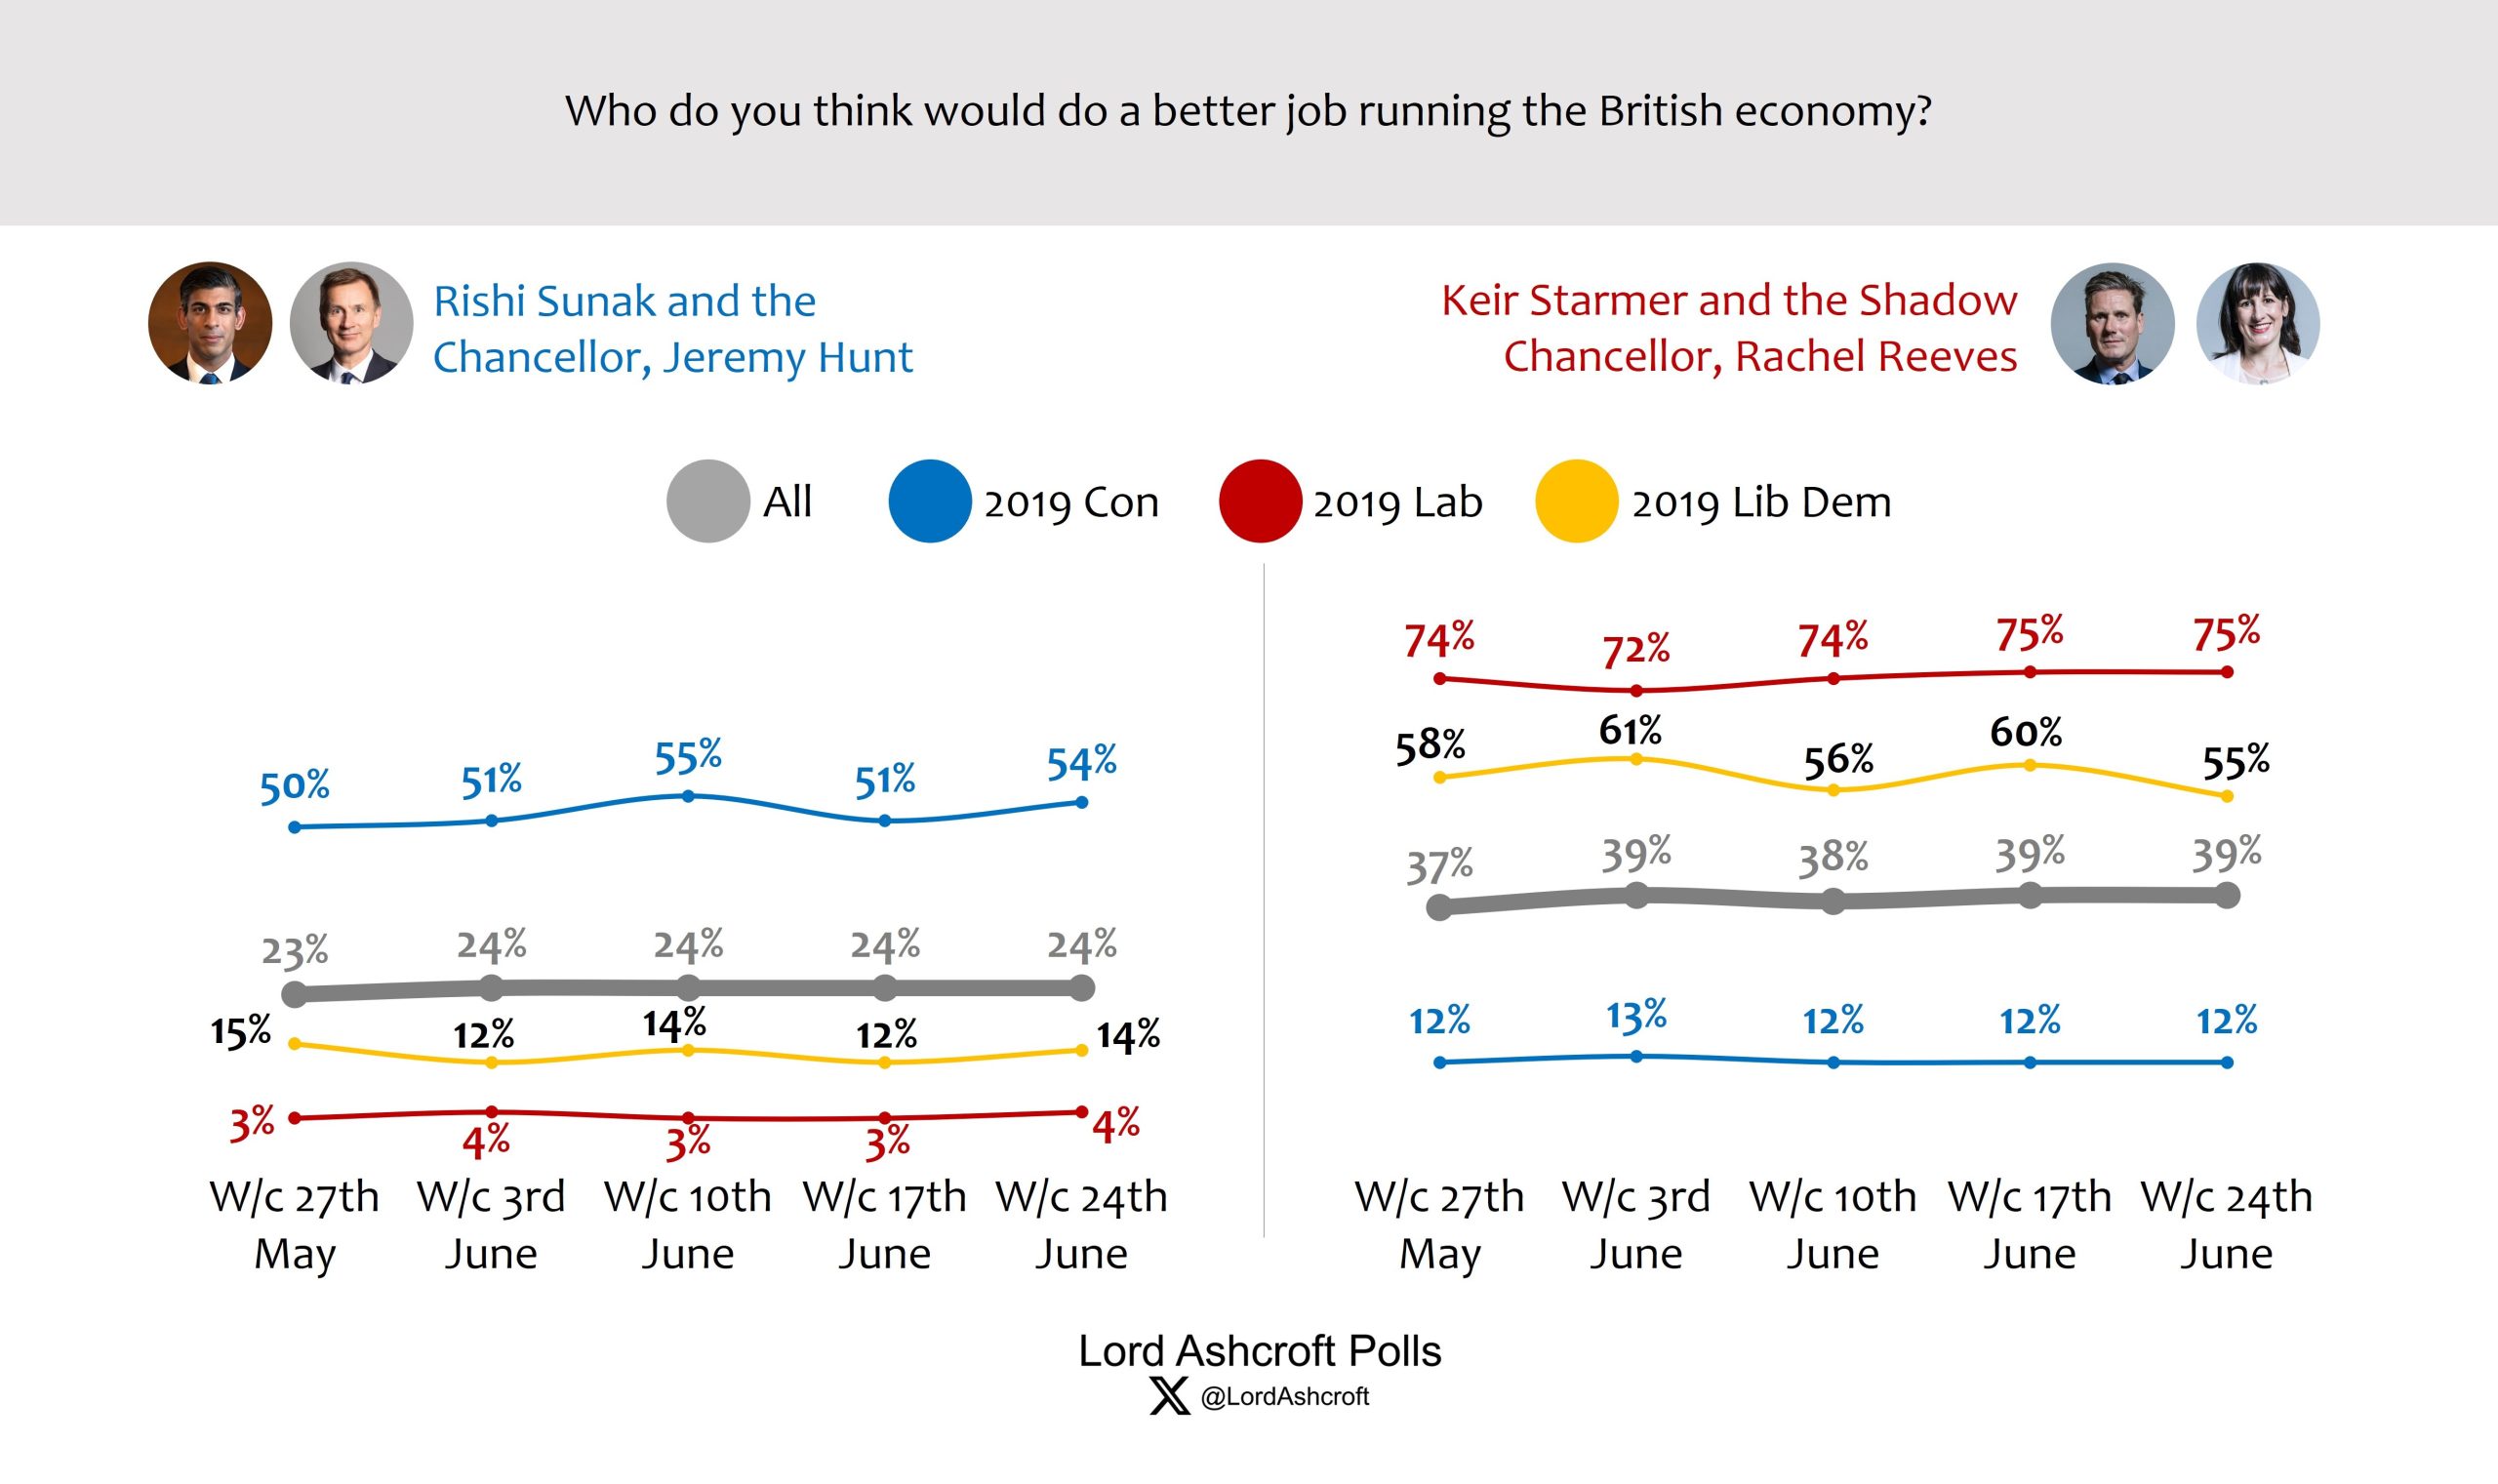
Voters currently leaning towards Reform UK preferred Sunak over Starmer by 24 per cent to eight per cent, with 68 per cent saying “don’t know”. On the question of who would do the better job running the British economy, the Labour team’s lead is also unchanged since last week’s survey.
The proportion of voters saying they are satisfied with the current government remains unchanged since last week at one in 20. This includes eight per cent of those who voted Conservative in 2019.
However, 81 per cent of 2019 Tories who say they don’t know or won’t vote say they prefer a Conservative government to a Labour one, as do 84 per cent of 2019 Tories currently leaning towards Reform UK.
Voting likelihood
Among 2019 Tories, the mean likelihood of voting Conservative again on 4 July was 39/100, up two points from last week’s low of 37.
Taking only those who put their chances of voting for their most likely party at 50/100 or above, we find 40 per cent saying they are currently most likely to vote Labour, 19 per cent Conservative, 17 per cent Reform UK and ten per cent Lib Dem. This compares to last week’s figures of Labour on 43 per cent and the Conservatives and Reform both with 18 per cent.
At the same time, only half of all voters say they have definitely decided what they are going to do on 4 July. Those leaning towards Labour were the most likely to say they had made up their minds (72 per cent).
Those currently intending to back Reform UK were more likely to say this (67 per cent) than those leaning towards the Conservatives (63 per cent) or the Lib Dems (59 per cent).
The political map
Our political map shows how different issues, attributes, personalities and opinions interact with one another. Each point shows where we are most likely to find people with that characteristic or opinion; the closer the plot points are to each other the more closely related they are.
Here we see the distribution of favourability towards different political personalities – in particular, whether prominent Conservatives are most likely to be seen positively in the more prosperous traditional Tory top-right quadrant, or in the less secure, Leave-voting bottom right where Conservative support has collapsed since many voted for the party for the first time in 2019.
We also see that those most likely to think the economy is improving are in the already better-off top half of the map, and of those, the view that the government deserves some credit are in the most Tory-supporting territory.
Full data available at LordAshcroftPolls.com.